Southwest Airlines Q3 2026 Financial Results: Record $8.42B Revenue and Commercial Transformation Drive 500% Adjusted EPS Surge
Key Takeaways
Record Top-Line Expansion: Southwest Airlines generated $8.422 billion in Q3 2026 operating revenue, representing a 21.2% year-over-year increase fueled entirely by pricing power and new ancillary streams rather than capacity additions.
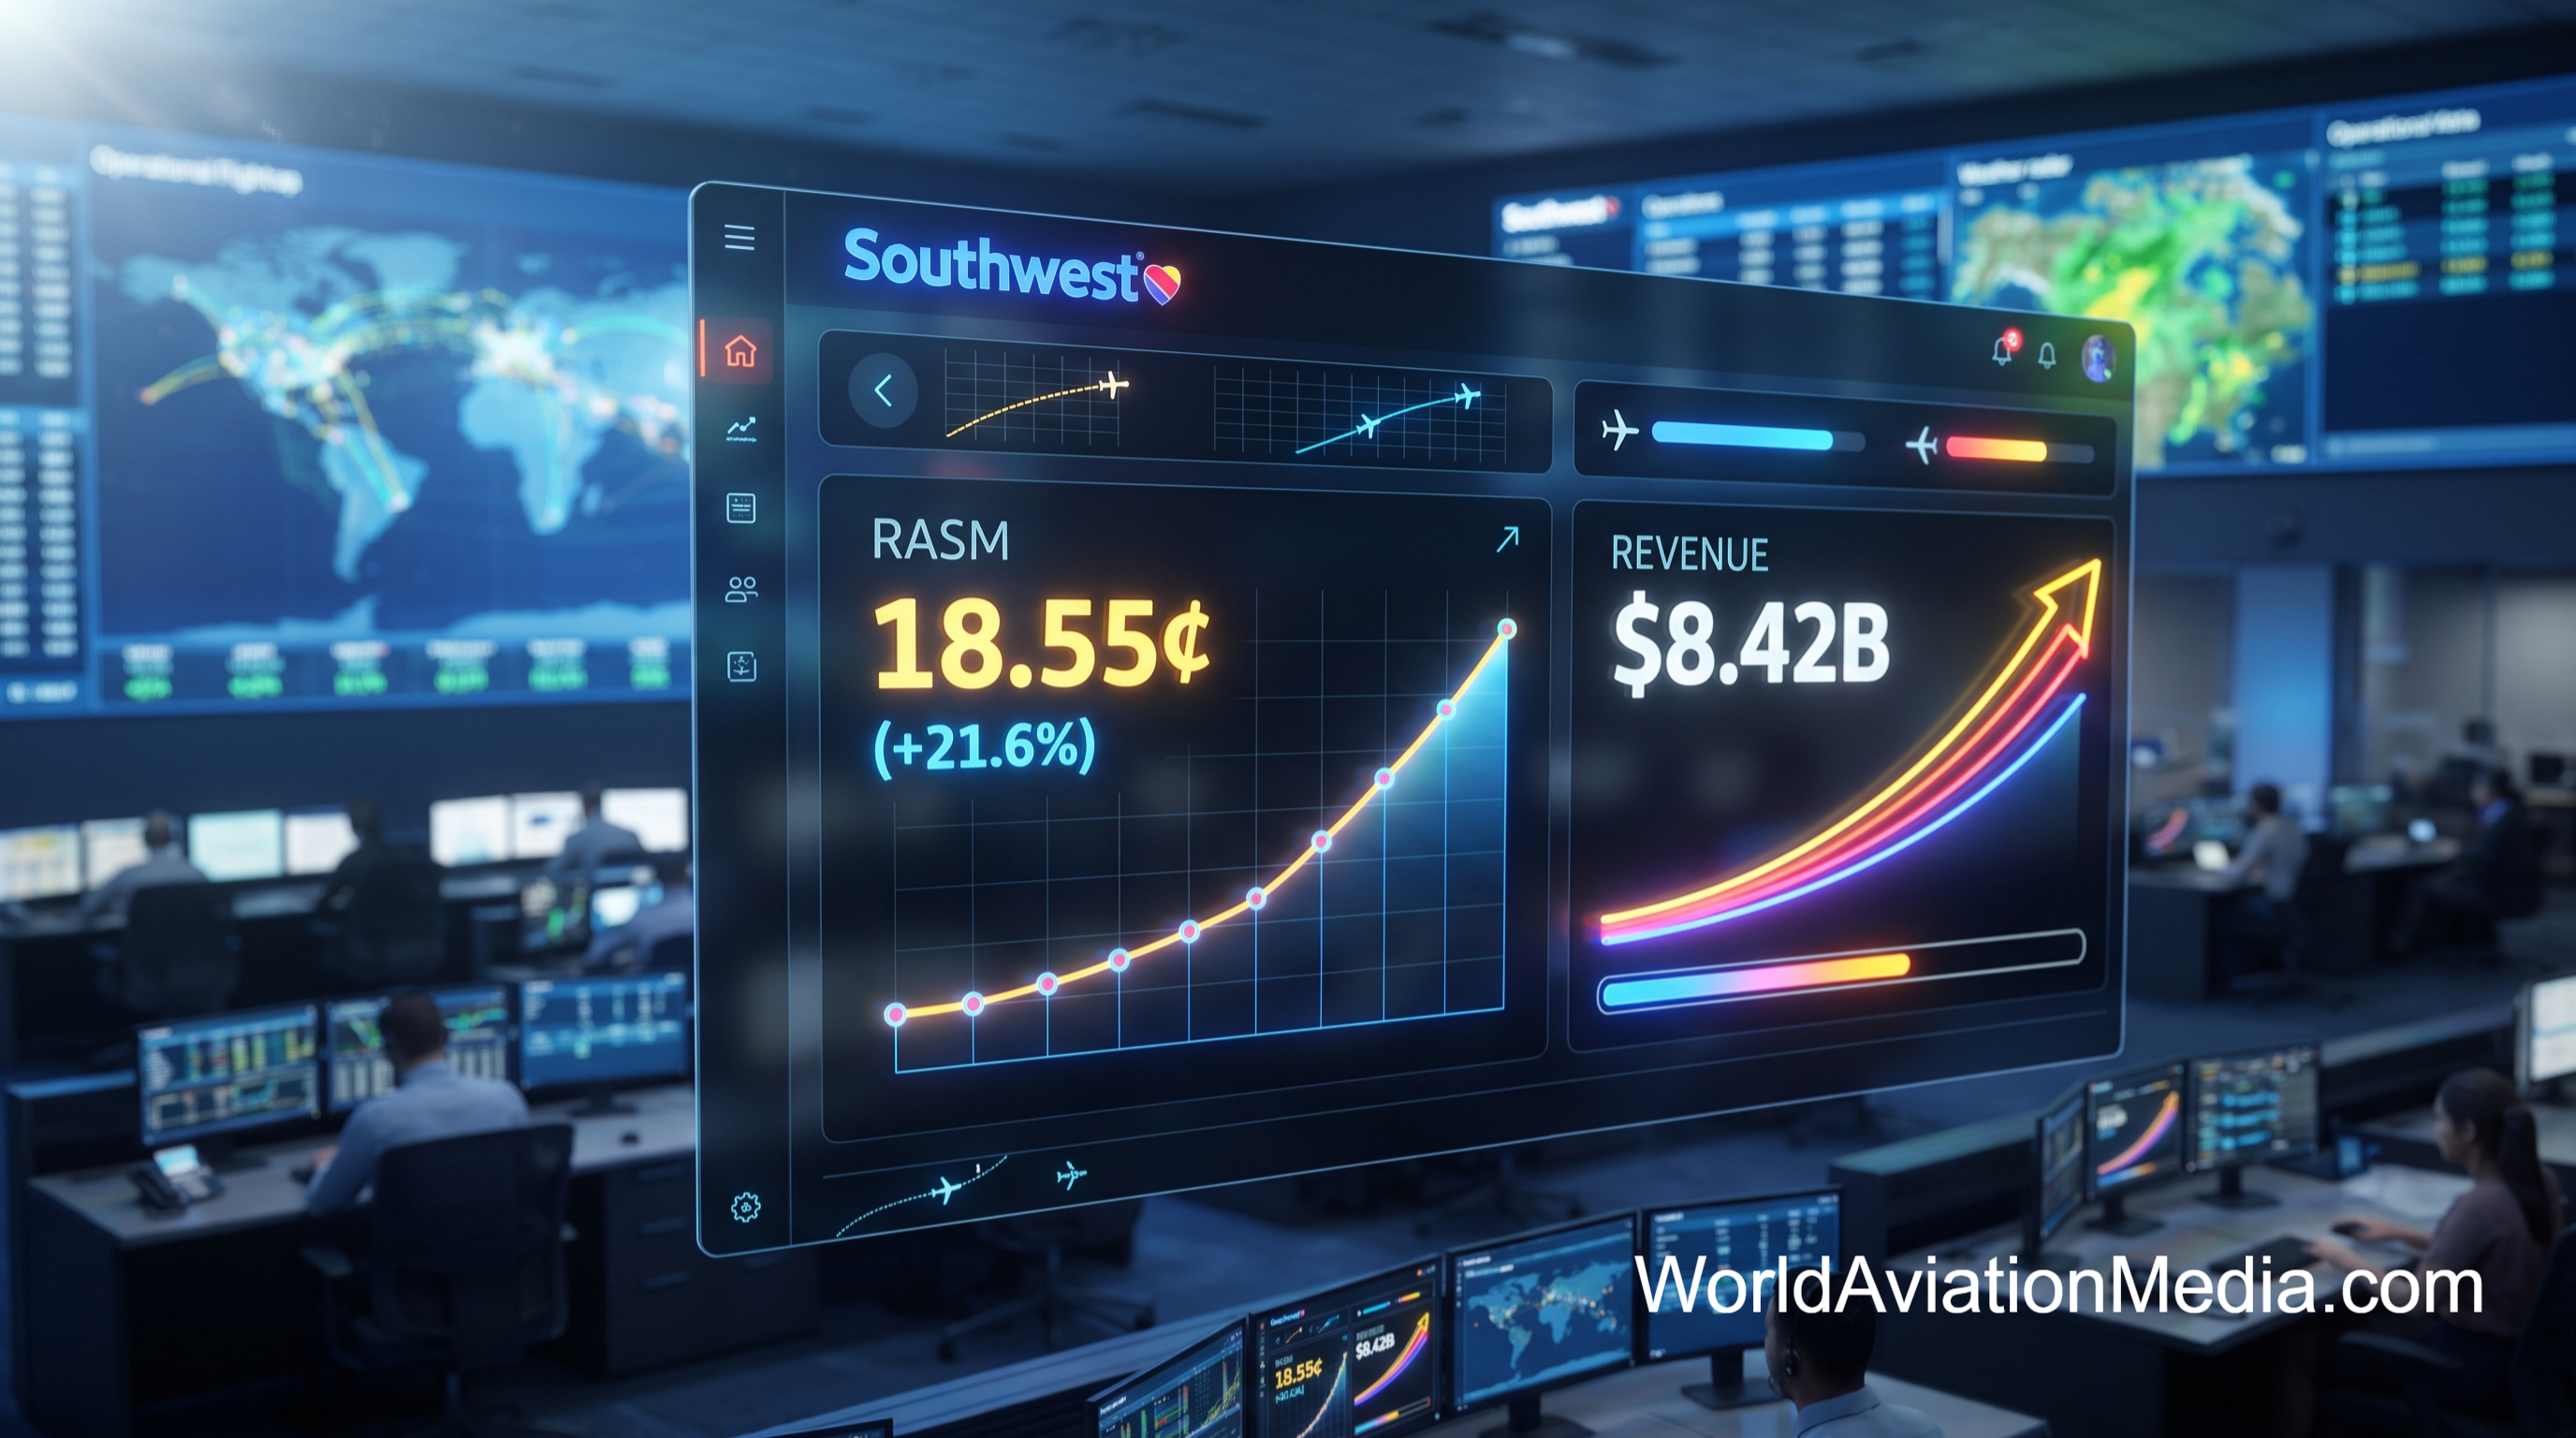
Historic Unit Revenue Performance: Revenue per available seat mile (RASM) surged 21.6% year-over-year to an all-time company record of 18.55 cents, supported by a 26.9% jump in average passenger fares ($231.69) and a 23.3% increase in passenger yield.
Profitability Outpaces Fuel Headwinds: Despite absorbing an 821millionyear-over-yearspikeinfuelexpenses(3.92 per gallon, up 63.3%), GAAP net income quintupled to 270million(0.55 diluted EPS), while adjusted net income reached 328million(0.66 diluted EPS, up 500%).
Disciplined Non-Fuel Cost Control: Non-fuel unit costs (CASM-X, excluding special items and profit sharing) rose a modest 3.8% year-over-year, creating an 18-point positive spread against RASM growth that expanded adjusted operating margins by 4.8 percentage points to 5.4%.
Fleet Monetization Contribution: Operating income of $379 million (GAAP) and $452 million (adjusted) included $214 million in gains from aircraft and engine sale-leaseback transactions, highlighting active balance sheet management amid ongoing Boeing delivery delays.
What Were Southwest Airlines' Key Financial Metrics in Q3 2026?
Southwest Airlines Co. (NYSE: LUV) closed the third quarter of fiscal year 2026 with a decisive validation of its multi-year commercial overhaul. For the quarter ended September 30, 2026, the Dallas-based carrier reported total operating revenues of $8.422 billion, up 21.2% from the $6.949 billion recorded in Q3 2025. GAAP net income rose 400% year-over-year to 270million(0.55 per diluted share), compared to 54million(0.10 per diluted share) in the prior-year period. Excluding $73 million in special items—comprising $30 million in asset impairment charges, $30 million in severance-related restructuring expenses, and $13 million in litigation accruals—adjusted net income totaled $328 million, or $0.66 per diluted share, marking a 500% year-over-year earnings increase.
Financial & Operational Metric | Q3 2026 Actual | Q3 2025 Actual | YoY Change |
Total Operating Revenue | $8.422 Billion | $6.949 Billion | +21.2% |
Passenger Revenue | $7.753 Billion | $6.314 Billion | +22.8% |
GAAP Operating Income | $379 Million | $35 Million | +$344 Million |
Adjusted Operating Income | $452 Million | $42 Million | +$410 Million |
GAAP Operating Margin | 4.5% | 0.5% | +4.0 pts |
Adjusted Operating Margin | 5.4% | 0.6% | +4.8 pts |
GAAP Diluted EPS | $0.55 | $0.10 | +450.0% |
Adjusted Diluted EPS | $0.66 | $0.11 | +500.0% |
Operating Cash Flow | $513 Million | $287 Million | +78.7% |
RASM (Unit Revenue) | 18.55 cents | 15.25 cents | +21.6% |
Fuel Cost Per Gallon | $3.92 | $2.40 | +63.3% |
The core story of Southwest’s third-quarter performance lies in the divergence between physical volume and unit economics. Available seat miles (ASMs), the industry standard measure of capacity, contracted by 0.4% year-over-year, while revenue passenger miles (RPMs) similarly dipped 0.4%, leaving the system load factor completely flat at 79.8%. Total revenue passengers carried declined by 3.2%. Yet, despite carrying fewer passengers on slightly smaller capacity, passenger revenue jumped 22.8% to $7.75 billion.
How Did Commercial Initiatives Drive Record Unit Revenue?
For decades, Southwest Airlines operated under an egalitarian, unbundled-averse business model defined by open seating and universal free checked bags. Following activist investor pressure and margin compression in 2024 and 2025, management executed a structural pivot toward cabin segmentation, assigned seating, extra-legroom fare tiers, and unbundled baggage fees. Q3 2026 represents the full maturation of this commercial architecture.
Ancillary Monetization and Fare Architecture
By comparing Q3 2026 against the baseline of Q3 2025—when bag fees and tiered seating products were in their infancy—Southwest unlocked unprecedented yield expansion. The average passenger fare rose 26.9% year-over-year to $231.69, pushing passenger yield up 23.3%. Consequently, RASM reached 18.55 cents, the highest quarterly unit revenue figure in Southwest’s corporate history. Customers demonstrated low price elasticity toward unbundled checked baggage fees and showed strong attachment rates for upgraded boarding and extended-legroom cabin zones.
Record Managed Corporate Travel Penetration
Historically viewed primarily as a leisure and point-to-point domestic carrier, Southwest captured substantial corporate market share during the third quarter. Following the full integration of Southwest’s inventory into major global distribution systems (GDS) and corporate travel management company (TMC) platforms, managed business revenue hit an all-time third-quarter record. Management noted that 20 of the top 50 highest managed-business booking days in the airline’s history occurred during Q3 2026. High-yielding corporate travelers opted heavily into bundled business fares that include priority boarding, refundable flexibility, and ancillary fee waivers.
Navigating the 2026 Jet Fuel Shock and Cost Pressures
Across the global aviation sector, the third quarter of 2026 was defined by a severe energy price shock that drove jet fuel prices above $3.90 per gallon across North America. For Southwest, total fuel and oil expense surged by $821 million year-over-year to reach $2.15 billion. The carrier’s average economic fuel cost per gallon rose 63.3% from $2.40 in Q3 2025 to $3.92 in Q3 2026, surpassing management’s July guidance range of $3.70 to $3.75 per gallon.
Fuel Recapture Mechanics
Out of the $1.473 billion in incremental top-line revenue Southwest generated in Q3 2026 compared to Q3 2025, approximately 55.7% ($821 million) was immediately absorbed by higher refinery and crude oil costs. Management calculated that the year-over-year fuel price escalation directly reduced adjusted diluted EPS by $1.08. However, unlike ultra-low-cost and regional peers whose margins collapsed under the $3.92/gallon burden, Southwest recaptured 100% of the fuel headwind through its 21.6% RASM expansion, banking the remaining $652 million in revenue growth to cover non-fuel inflation and expand operating profit.
Non-Fuel Unit Costs (CASM-X) and Sale-Leaseback Gains
Total operating expenses increased 16.3% year-over-year—nearly five full percentage points slower than revenue growth. Non-fuel unit costs excluding special items and profit sharing (CASM-X) increased 3.8% year-over-year. Primary inflationary drivers included:
Labor Inflation: Salaries, wages, and benefits increased 10.0% year-over-year, reflecting step-up rates in ratified pilot, flight attendant, and ground operations collective bargaining agreements.
Airport Infrastructure Costs: Landing fees and airport terminal rentals rose 13.7% year-over-year as municipal airport authorities passed through capital improvement bond costs.
Fleet Monetization Offsets: Equity analysts scrutinizing the repeatability of Southwest’s Q3 margin expansion noted that operating expenses were reduced by $214 million in gains from aircraft and spare engine sales and sale-leaseback transactions. Because Southwest classifies fleet monetization as an ongoing part of its fleet modernization strategy rather than a special item, these 214millioningainsdirectlybolsteredbothGAAP(379 million) and adjusted ($452 million) operating income. Without sale-leaseback gains, adjusted operating income would have stood at $238 million—still nearly six times higher than Q3 2025, but indicative of the heavy underlying burden of $3.92/gallon jet fuel.
Cash Flow, Balance Sheet, and Q4 2026 Outlook
Operating cash flow jumped 78.7% year-over-year to $513 million in Q3 2026, up from $287 million in Q3 2025. By constraining capacity growth (-0.4% ASMs), retiring older Boeing 737-700 airframes into a supply-constrained secondary market, and monetizing delivery slots via sale-leasebacks, Southwest fortified its liquidity profile while maintaining an investment-grade balance sheet.
Entering the fourth quarter of 2026, Southwest faces escalating energy headwinds as forward jet fuel curves across U.S. hubs approach $4.65 to $4.80 per gallon. However, with capacity discipline firmly entrenched across the domestic market and corporate travel momentum accelerating into the holiday peak, Southwest’s transformed revenue management engine positions the carrier to defend profitability where legacy unbundled carriers previously struggled.
5-Item Q&A Section (FAQ)
Q1: What was Southwest Airlines' revenue and EPS in Q3 2026?
In Q3 2026, Southwest Airlines reported record third-quarter operating revenue of $8.422 billion, an increase of 21.2% year-over-year. GAAP diluted earnings per share (EPS) reached $0.55 on net income of $270 million, while adjusted diluted EPS rose 500% year-over-year to $0.66 on adjusted net income of $328 million.
Q2: How did Southwest Airlines achieve record RASM in Q3 2026 despite lower passenger volume?
Southwest achieved an all-time record RASM of 18.55 cents (+21.6% YoY) while carrying 3.2% fewer passengers by monetizing its new commercial model. The introduction of checked baggage fees, assigned and extra-legroom seating tiers, and record managed corporate bookings drove a 26.9% increase in average passenger fare ($231.69) and a 23.3% surge in passenger yield.
Q3: How much did rising jet fuel prices impact Southwest Airlines in Q3 2026?
Jet fuel expenses rose by $821 million year-over-year to $2.15 billion in Q3 2026. Southwest's average fuel cost per gallon jumped 63.3% from $2.40 in Q3 2025 to $3.92 in Q3 2026, absorbing roughly 56% of the company's year-over-year revenue gains and reducing adjusted diluted EPS by an estimated $1.08.
Q4: What role did aircraft sale-leaseback transactions play in Southwest's Q3 2026 operating profit?
Southwest recorded $214 million in gains from aircraft and engine sales and sale-leaseback transactions during Q3 2026. Because these gains were not excluded as special items, they accounted for roughly 47% of Southwest's $452 million in adjusted operating income, serving as an important offset to labor and fuel inflation.
Q5: What was Southwest Airlines' non-fuel unit cost (CASM-X) growth in Q3 2026?
Southwest's CASM-X (unit costs excluding fuel, special items, and profit sharing) increased by 3.8% year-over-year in Q3 2026. While salaries and wages rose 10.0% and airport landing fees increased 13.7%, disciplined capacity management (-0.4% ASMs) and sale-leaseback credits kept overall non-fuel cost growth well below the 21.6% RASM expansion.
Metadata
Target SEO Keywords: Southwest Airlines Q3 2026 financial results, LUV Q3 2026 earnings report, Southwest Airlines RASM record 2026, Southwest bag fee revenue impact, airline fuel cost headwinds Q3 2026, Southwest Airlines sale-leaseback gains, LUV stock earnings analysis.
Hashtags: #SouthwestAirlines #LUVStock #Q32026Earnings #AviationFinance #AirlineEarnings #CommercialAviation #UnitRevenue
