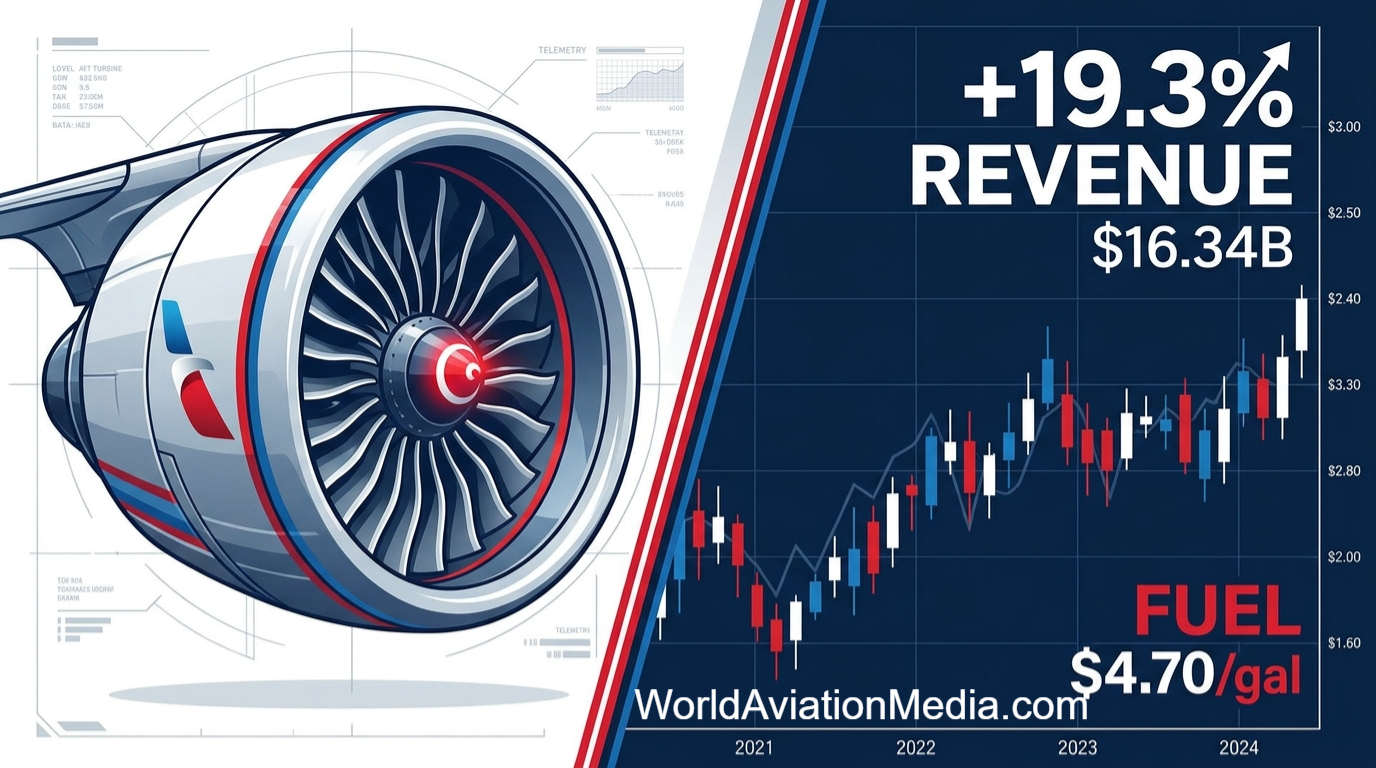
American Airlines Q3 2026 Financial Results: Record $16.34B Revenue and 28% Corporate Surge Offset $4.70 Q4 Fuel Warning
Key Takeaways
Top- and Bottom-Line Earnings Beat: American Airlines Group reported Q3 2026 revenue of $16.34 billion (+19.3% YoY), beating Wall Street consensus by $122.35 million, while posting an adjusted loss of -$0.28 per diluted share, outperforming the -$0.36 consensus estimate.
Commercial Recovery Accelerates: Total unit revenue (TRASM) climbed 14.5% year-over-year with positive momentum across all geographies and cabin classes, marking the strongest non-pandemic quarterly revenue growth in CEO Robert Isom’s career.
Corporate & SMB Rebound: Managed corporate revenue jumped 28% year-over-year (the sixth consecutive quarter of double-digit growth), travel management company (TMC) channel sales rose 27%, and AAdvantage Business (small-and-medium enterprise) revenue surged 46%.
Industry-Leading Cost Execution: Non-fuel unit costs (CASM-ex) increased approximately 3.0% year-over-year, beating the midpoint of July guidance and extending American’s track record of meeting or beating CASM-ex targets to 14 of the past 15 quarters.
Severe Q4 Fuel Headwind Warning: Management projected Q4 2026 average jet fuel prices at approximately $4.70 per gallon—nearly double prior-year levels—creating a massive $2.8 billion year-over-year fourth-quarter fuel expense headwind despite forecasted Q4 revenue growth of 19.5% to 22.5%.
How Did American Airlines Perform in Q3 2026 Against Wall Street Expectations?
American Airlines Group Inc. (NASDAQ: AAL) delivered a resilient commercial performance in the third quarter of fiscal year 2026, surpassing Wall Street expectations on both revenue and earnings per share while navigating an acute industry-wide jet fuel spike. For the quarter ended September 30, 2026, American generated total operating revenue of $16.34 billion, representing a 19.3% year-over-year increase and topping consensus analyst estimates of $16.21 billion by $122.35 million.
On the bottom line, American reported an adjusted net loss of $0.28 per diluted share, beating the consensus forecast of -$0.3610 per share by $0.081 (and coming in ahead of the midpoint of management's July guidance). This marks the seventh time in the past eight quarters that American Airlines has beaten consensus EPS estimates. However, the -$0.28 adjusted EPS compares to -$0.17 in Q3 2025, illustrating how soaring energy prices prevented double-digit top-line growth from translating into positive GAAP net profitability during the late summer quarter.
Key Financial & Commercial Metric | Q3 2026 Actual | Consensus / YoY Benchmark | Performance Variance |
Total Operating Revenue | $16.34 Billion | $16.21 Billion (Est.) | Beat by +$122.35M (+19.3% YoY) |
Adjusted Diluted EPS | -$0.28 | -$0.3610 (Est.) | Beat by +0.0810(vs-0.17 Q3 25) |
Total Unit Revenue (TRASM) | +14.5% YoY | Guided Low-Double Digits | Above High End of Guidance |
CASM-ex (Non-Fuel Unit Cost) | ~+3.0% YoY | Guided +2.5% to +4.5% | Beat Midpoint of Guidance |
Managed Corporate Revenue | +28.0% YoY | 6th Consecutive Double-Digit Qtr | Strong Share Recapture |
AAdvantage Business (SMB) | +46.0% YoY | TMC Channel +27.0% YoY | High-Yield Channel Expansion |
Total Ending Liquidity | $11.8 Billion | Net Debt Target: ~$30.5B YE26 | Flat YoY Net Debt Profile |
How Did American Airlines Repair Its Corporate Sales Channel?
Following the missteps of its 2023–2024 direct-distribution strategy (which alienated corporate travel buyers and travel management companies), American Airlines spent 2025 and 2026 methodically rebuilding its B2B commercial relationships. Under Chief Commercial Officer Nat Pieper and CEO Robert Isom, the third quarter of 2026 demonstrated complete restoration—and active share expansion—across high-yield business channels.
Enterprise and TMC Channel Momentum
During the Q3 2026 earnings call, CEO Robert Isom noted that excluding the immediate post-pandemic reopening rebound, the 19.3% top-line surge represented the strongest quarterly revenue growth of his career. Total unit revenue (TRASM) rose 14.5% year-over-year, supported by balanced yield strength across domestic hubs and international long-haul gateways.
Specifically, managed corporate revenue rose 28% year-over-year, marking American’s sixth consecutive quarter of double-digit corporate expansion. Sales routed through traditional Travel Management Company (TMC) agencies expanded by 27% year-over-year. Even more impressively, small-and-medium business bookings captured through the proprietary AAdvantage Business portal surged 46% year-over-year. Because corporate and SMB tickets are typically booked closer to departure at higher fare buckets, yields across all three business channels significantly bolstered system RASM.
Citi Co-Branded Loyalty Ecosystem
American’s loyalty program and co-branded credit card portfolio continued to provide high-margin cash flow stability. Total spending on Citi co-branded AAdvantage credit cards increased nearly 10% year-over-year in Q3 2026. Management emphasized that the expanded long-term exclusive partnership with Citigroup is tracking ahead of internal targets, creating a durable, high-margin annuity stream that insulates top-line revenue during macroeconomic fluctuations.
Operational Cost Discipline vs. The Q4 2026 Fuel Shock
Under CFO Devon May, American Airlines has established one of the most predictable non-fuel cost structures among the U.S. "Big Three" network carriers. In Q3 2026, CASM-ex (operating cost per available seat mile excluding fuel and special items) rose approximately 3.0% year-over-year, outperforming the midpoint of the guidance range issued in July 2026. American has now met or beaten its quarterly CASM-ex guidance in 14 of the past 15 quarters—a stark contrast to peers experiencing high-single-digit non-fuel cost inflation.
The $4.70/Gallon Fourth-Quarter Energy Wall
Despite stellar revenue growth (+19.3%) and tight non-fuel cost control (+3.0% CASM-ex), American’s profitability was heavily compressed by jet fuel prices in Q3, and management issued a sobering assessment of fourth-quarter energy costs. Based on the forward energy curve as of October 19, 2026, American expects its average all-in jet fuel price in Q4 2026 to reach approximately $4.70 per gallon—nearly double the price paid in Q4 2025.
At $4.70 per gallon, American’s fourth-quarter fuel expense will be approximately $2.8 billion higher year-over-year. To counter this massive cost shock, industry capacity reductions and aggressive fare pricing are driving rapid top-line expansion: American guided Q4 2026 total revenue to grow between 19.5% and 22.5% year-over-year. Management noted that once jet fuel prices stabilize or mean-revert, the combination of 20%+ revenue momentum and 3% CASM-ex discipline is coiled to produce substantial margin expansion.
Balance Sheet, Fleet CapEx, and Leverage Trajectory
American ended Q3 2026 with $11.8 billion in total available liquidity. However, because the $2.8 billion Q4 fuel headwind limits near-term free cash flow generation, year-end 2026 net debt is projected to remain at approximately $30.5 billion, roughly flat compared to year-end 2025. For full-year 2026, American remains on track to take delivery of 47 new aircraft (comprising Boeing 737 MAX 8s, Boeing 787-9 Dreamliners, and Airbus A321neos/XLRs), corresponding to total capital expenditures of $4.0 billion to $4.5 billion. While balance sheet deleveraging is temporarily paused by $4.70/gallon fuel, American’s moderate fleet renewal schedule ensures no peak CapEx spikes over the medium term.
5-Item Q&A Section (FAQ)
Q1: Did American Airlines beat Q3 2026 earnings and revenue estimates?
Yes. American Airlines reported Q3 2026 revenue of $16.34 billion (+19.3% YoY), beating the $16.21 billion consensus estimate by $122.35 million. Its adjusted diluted loss per share of -$0.28 beat the consensus estimate of -$0.3610 by $0.081 per share.
Q2: How fast is American Airlines' corporate travel revenue growing in 2026?
In Q3 2026, American's managed corporate revenue grew 28% year-over-year—its sixth consecutive quarter of double-digit growth. Additionally, Travel Management Company (TMC) channel revenue increased 27%, and small-to-medium business revenue via AAdvantage Business surged 46% year-over-year.
Q3: Why did American Airlines report a net loss in Q3 2026 despite 19.3% revenue growth?
Rapidly escalating jet fuel costs absorbed the gains from American's 14.5% unit revenue (TRASM) growth and 3.0% non-fuel cost (CASM-ex) execution, resulting in an adjusted loss of -$0.28 per share.
Q4: What is American Airlines' Q4 2026 revenue and fuel price guidance?
American Airlines expects Q4 2026 revenue to grow between 19.5% and 22.5% year-over-year. However, based on the October 19, 2026 forward curve, the carrier projects an average Q4 fuel price of ~$4.70 per gallon (nearly double Q4 2025), which will increase fourth-quarter fuel expense by approximately $2.8 billion year-over-year.
Q5: What is American Airlines' liquidity and net debt position at the end of Q3 2026?
American ended Q3 2026 with $11.8 billion in total liquidity and expects year-end 2026 net debt to stand at approximately $30.5 billion, roughly unchanged from year-end 2025 due to fuel-induced margin compression. Full-year 2026 capital expenditures are projected at $4.0 billion to $4.5 billion across 47 new aircraft deliveries.
Metadata
Target SEO Keywords: American Airlines Q3 2026 financial results, AAL Q3 2026 earnings call transcript, American Airlines corporate revenue recovery, AAdvantage Business growth 2026, airline Q4 2026 fuel cost $4.70 gallon, Devon May CASM-ex guidance, AAL stock debt analysis.
Hashtags: #AmericanAirlines #AALStock #AirlineEarnings #Q32026Results #CorporateTravel #AviationEconomy #JetFuelPrices
